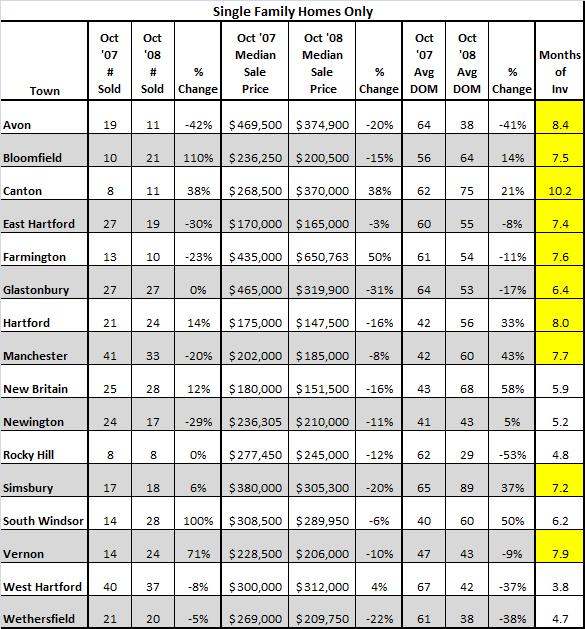
Another month has ended, so it’s time for real estate statistics in the Greater Hartford area. The data you see here is a result of houses that mostly went under contract in August, September and maybe early October. The sentiment among the majority of Realtors right now is that the market is very slow. There is a lot of uncertainty with the economy and the election. Hopefully after today, Buyers will have one less thing to worry about (who will be the President), so they can focus on thinking about buying houses. We’ll see. I have a feeling that the data for November will also be ugly, as October seemed, as one agent put it to me yesterday, “dreadful.”
So, what do we have here? Let’s take a look. All data was pulled from the Multiple Listing Service for single family houses and is deemed reliable, but not guaranteed…

My thoughts and observations…
1. Much of this data needs to be taken with a grain of salt (particularly median sale price), as we’re dealing with a small number of transactions in several of the towns. Quarterly data tends to be more statistically relevant, but readers are still clamoring for monthly stats, so I’m providing them.
2. We actually saw several towns have improvements in the number of closings in October of 2008 versus October of 2007. A few towns were still noticeably off, but many are an improvement over last month and the same month last year.
3. The number of Buyer’s markets, as indicated by the Months of Inventory column, is increasing. Anything highlighted Yellow is considered a Buyer’s market (6+ months of inventory). Anything highlighted White is a Neutral market (3-6 months of inventory). Right now, there are no towns that are Seller’s markets (0-3 months of inventory) in the Greater Hartford area.
Let me know if you have any specific questions or would like to see data for other towns.

