

A survey released by the U.S. Census Bureau Thursday provides data on the demographics of communities across Connecticut. The American Community Survey includes data from a five-year period, from 2016 to 2020.
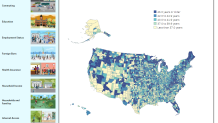
An interactive map allows people to look at data for each of Connecticut's eight counties.
The data ultimately helps policymakers evaluate where to allocate funds and how to best meet the needs of people living in Connecticut.
Get Connecticut local news, weather forecasts and entertainment stories to your inbox. Sign up for NBC Connecticut newsletters.
"It's really the most detailed survey that the Census does its use to understand community needs, how to deliver services and decide how to fund our cities and towns in the state," Mark Abraham, DataHaven Executive Director, said.
An interactive map breaks down data in 10 categories, county by county.
It gives details on median age, which is typically over 40 across Connecticut. Data on commute times shows people living in Connecticut spend between 23 and 31 minutes getting to work.


The percent of the population with a high school degree is 89 percent or higher statewide. The average household income in every county is $65,000 or more.
"Connecticut really tracks with the nation as a whole on a lot of these social and economic measures," Abraham said. "But it's a little bit more of a mixed story when you look at the cities and towns. A good example of that would be incomes rose much more quickly in Stamford, Connecticut, and Fairfield County, and in Waterbury, they didn't increase significantly. So it is showing sort of a difference that has to do with the types of jobs in those areas have access to economic opportunity.”
Experts say one area where Connecticut is very strong is in health coverage. Apart from Fairfield County, every county in the state has less than 5 percent of the population uninsured.
"There's been a lot said about Obamacare, and what Connecticut has done to try to increase health insurance in the state," Chris Haynes, Professor of Political Science at the University of New Haven said. "It looks like Connecticut, by and large, has done pretty well in terms of keeping down or lowering the number of uninsured."
But Haynes says the survey is revealing negative impacts of the COVID-19 pandemic when it comes to things like poverty and unemployment.
The counties with more than 10 percent of people living below the poverty line are Windham (11.5 percent), New Haven (11.2 percent), and Hartford (10.8 percent).
Two of those have corresponding high unemployment rates in the state, Windham (6.9 percent) and New Haven (6.4 percent), along with Fairfield County (6.6 percent).
"You tend to see this kind of stuff really kind of interconnect: poverty, unemployment, lack of education. Those types of things. And so I think that is something that, obviously, our policymakers are definitely focused on," Haynes said.
Another area where Connecticut could improve is in broadband access. Hartford, New Haven, and Windham Counties, which have the highest poverty rates, also have the fewest households with internet subscriptions.
Due to the onset of the pandemic in 2020, this survey got a lower response rate than in previous years. There is also not a lot of data that reflects the changes brought on by COVID-19.